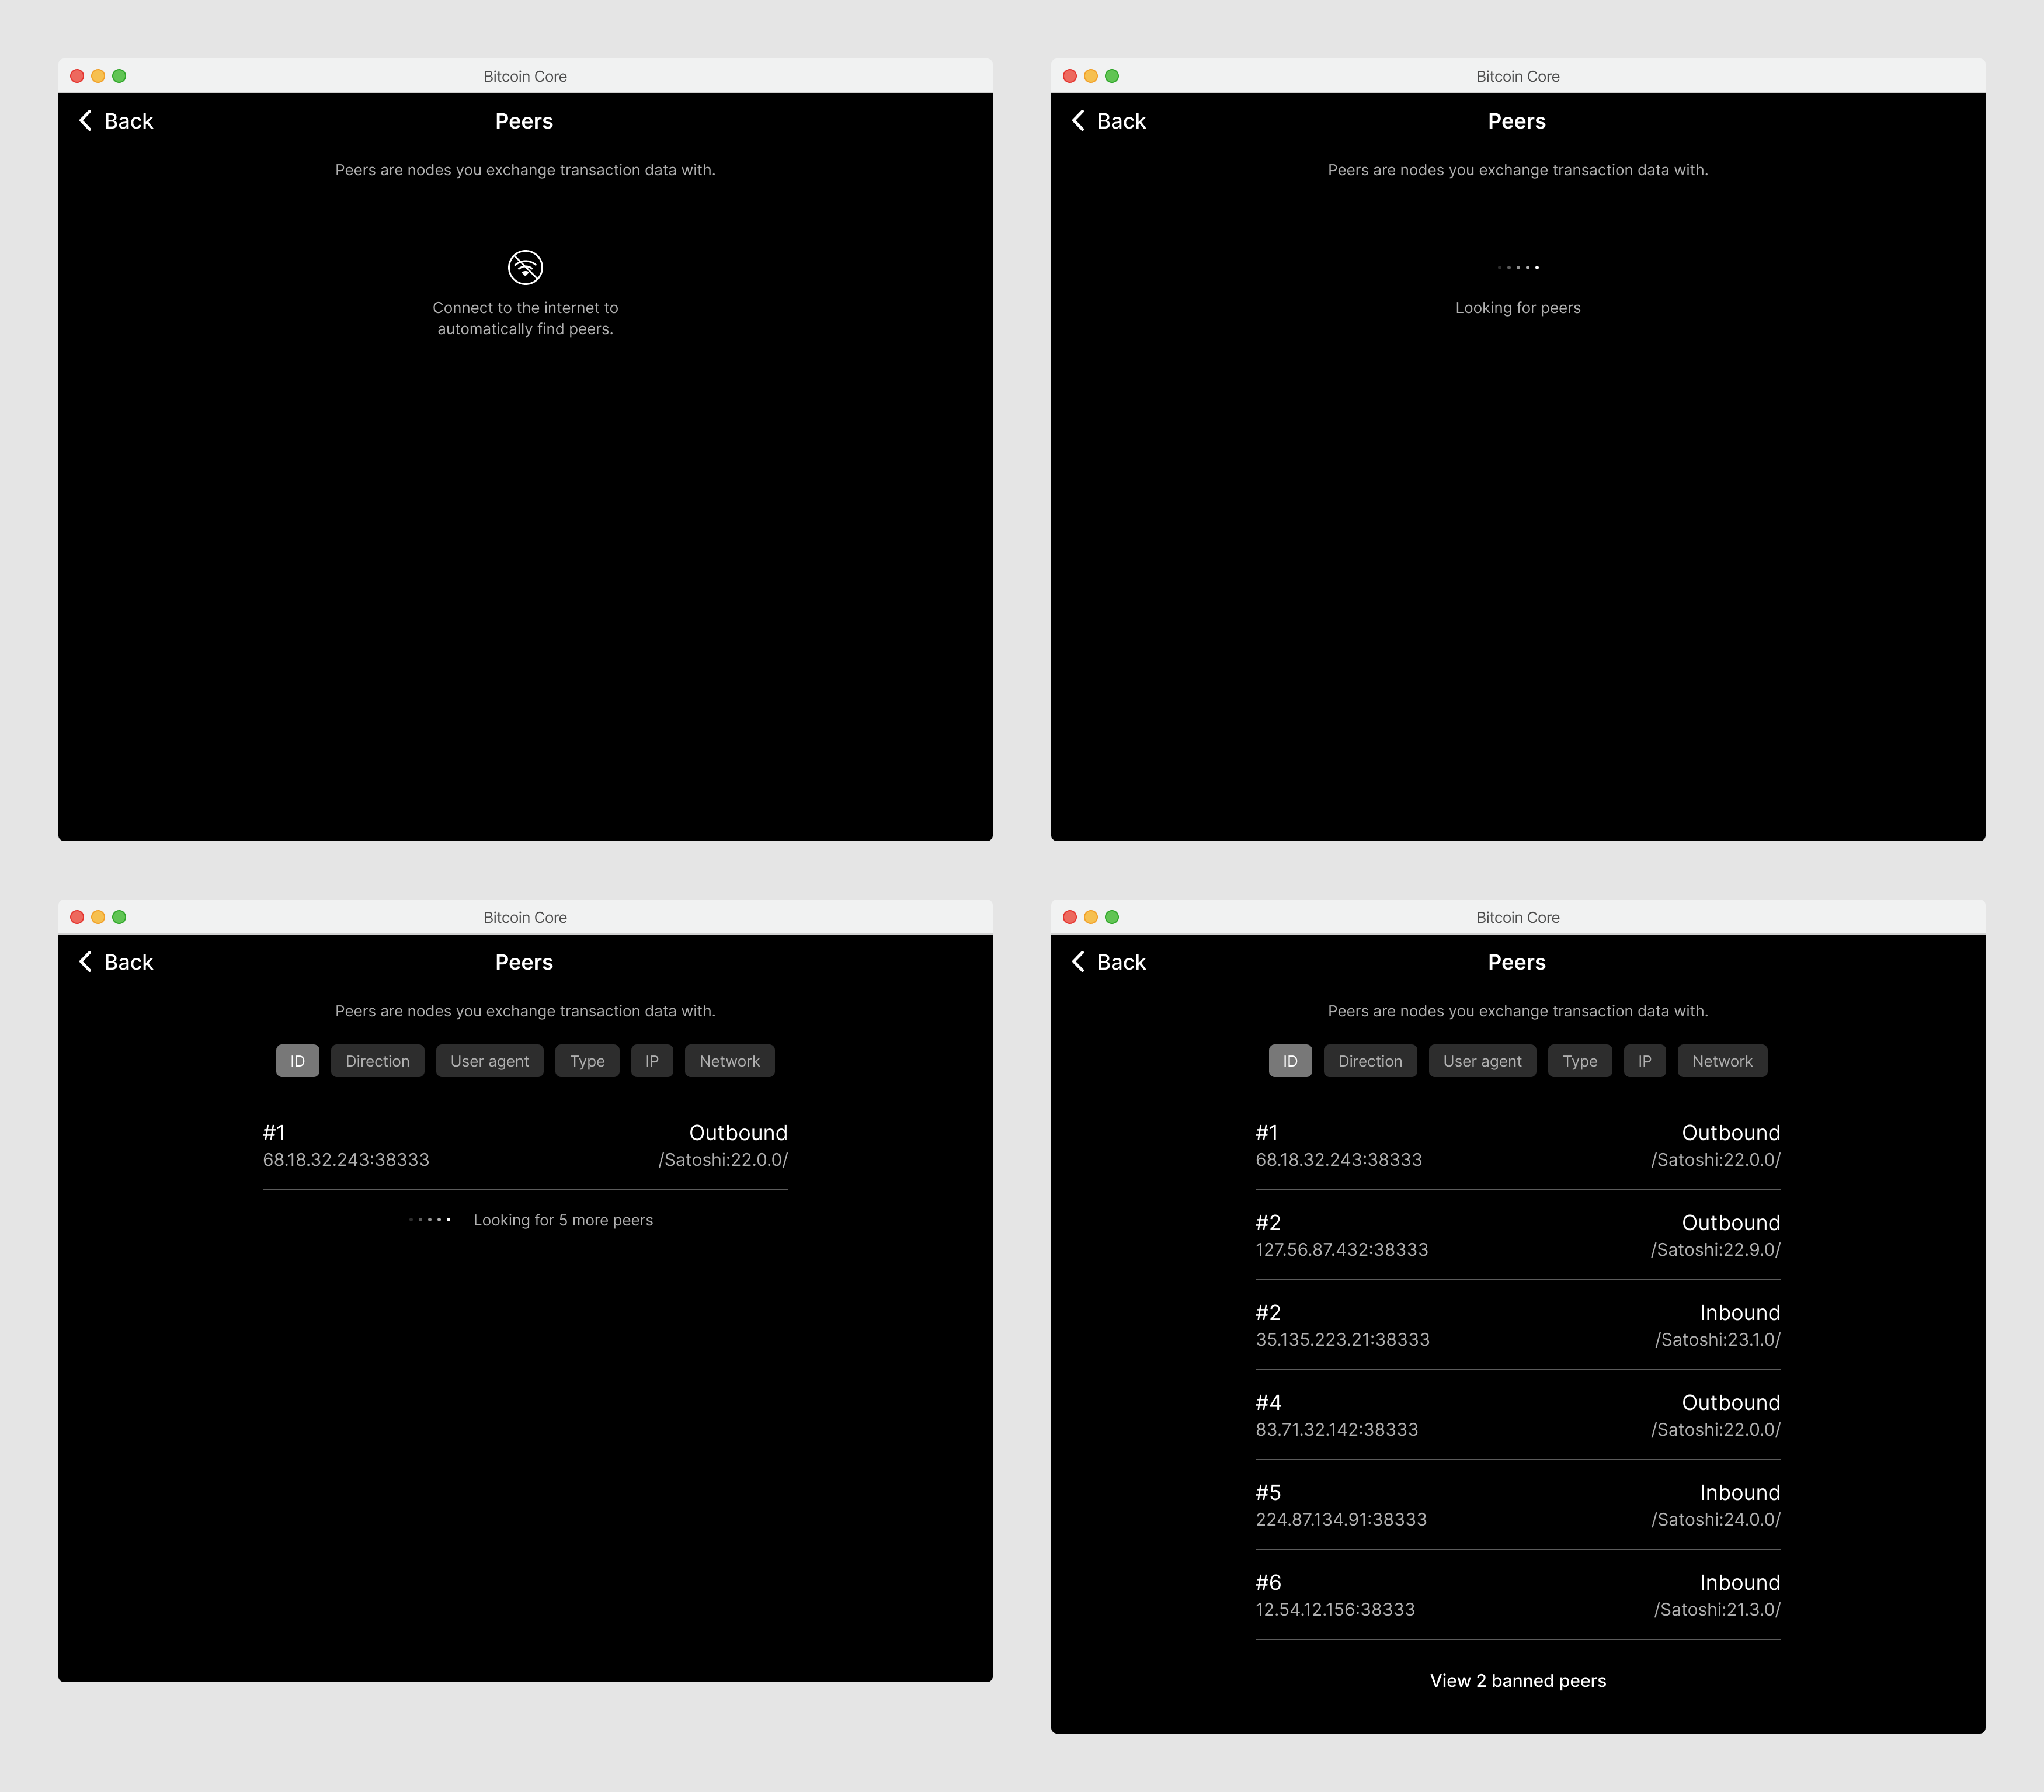
Peers
Shows other nodes the application is connected to. Provides users a detailed understanding of what is happening under the hood of the block status. The sorting buttons also define what detail is shown in each peer item, based on what is relevant for the selected filter.
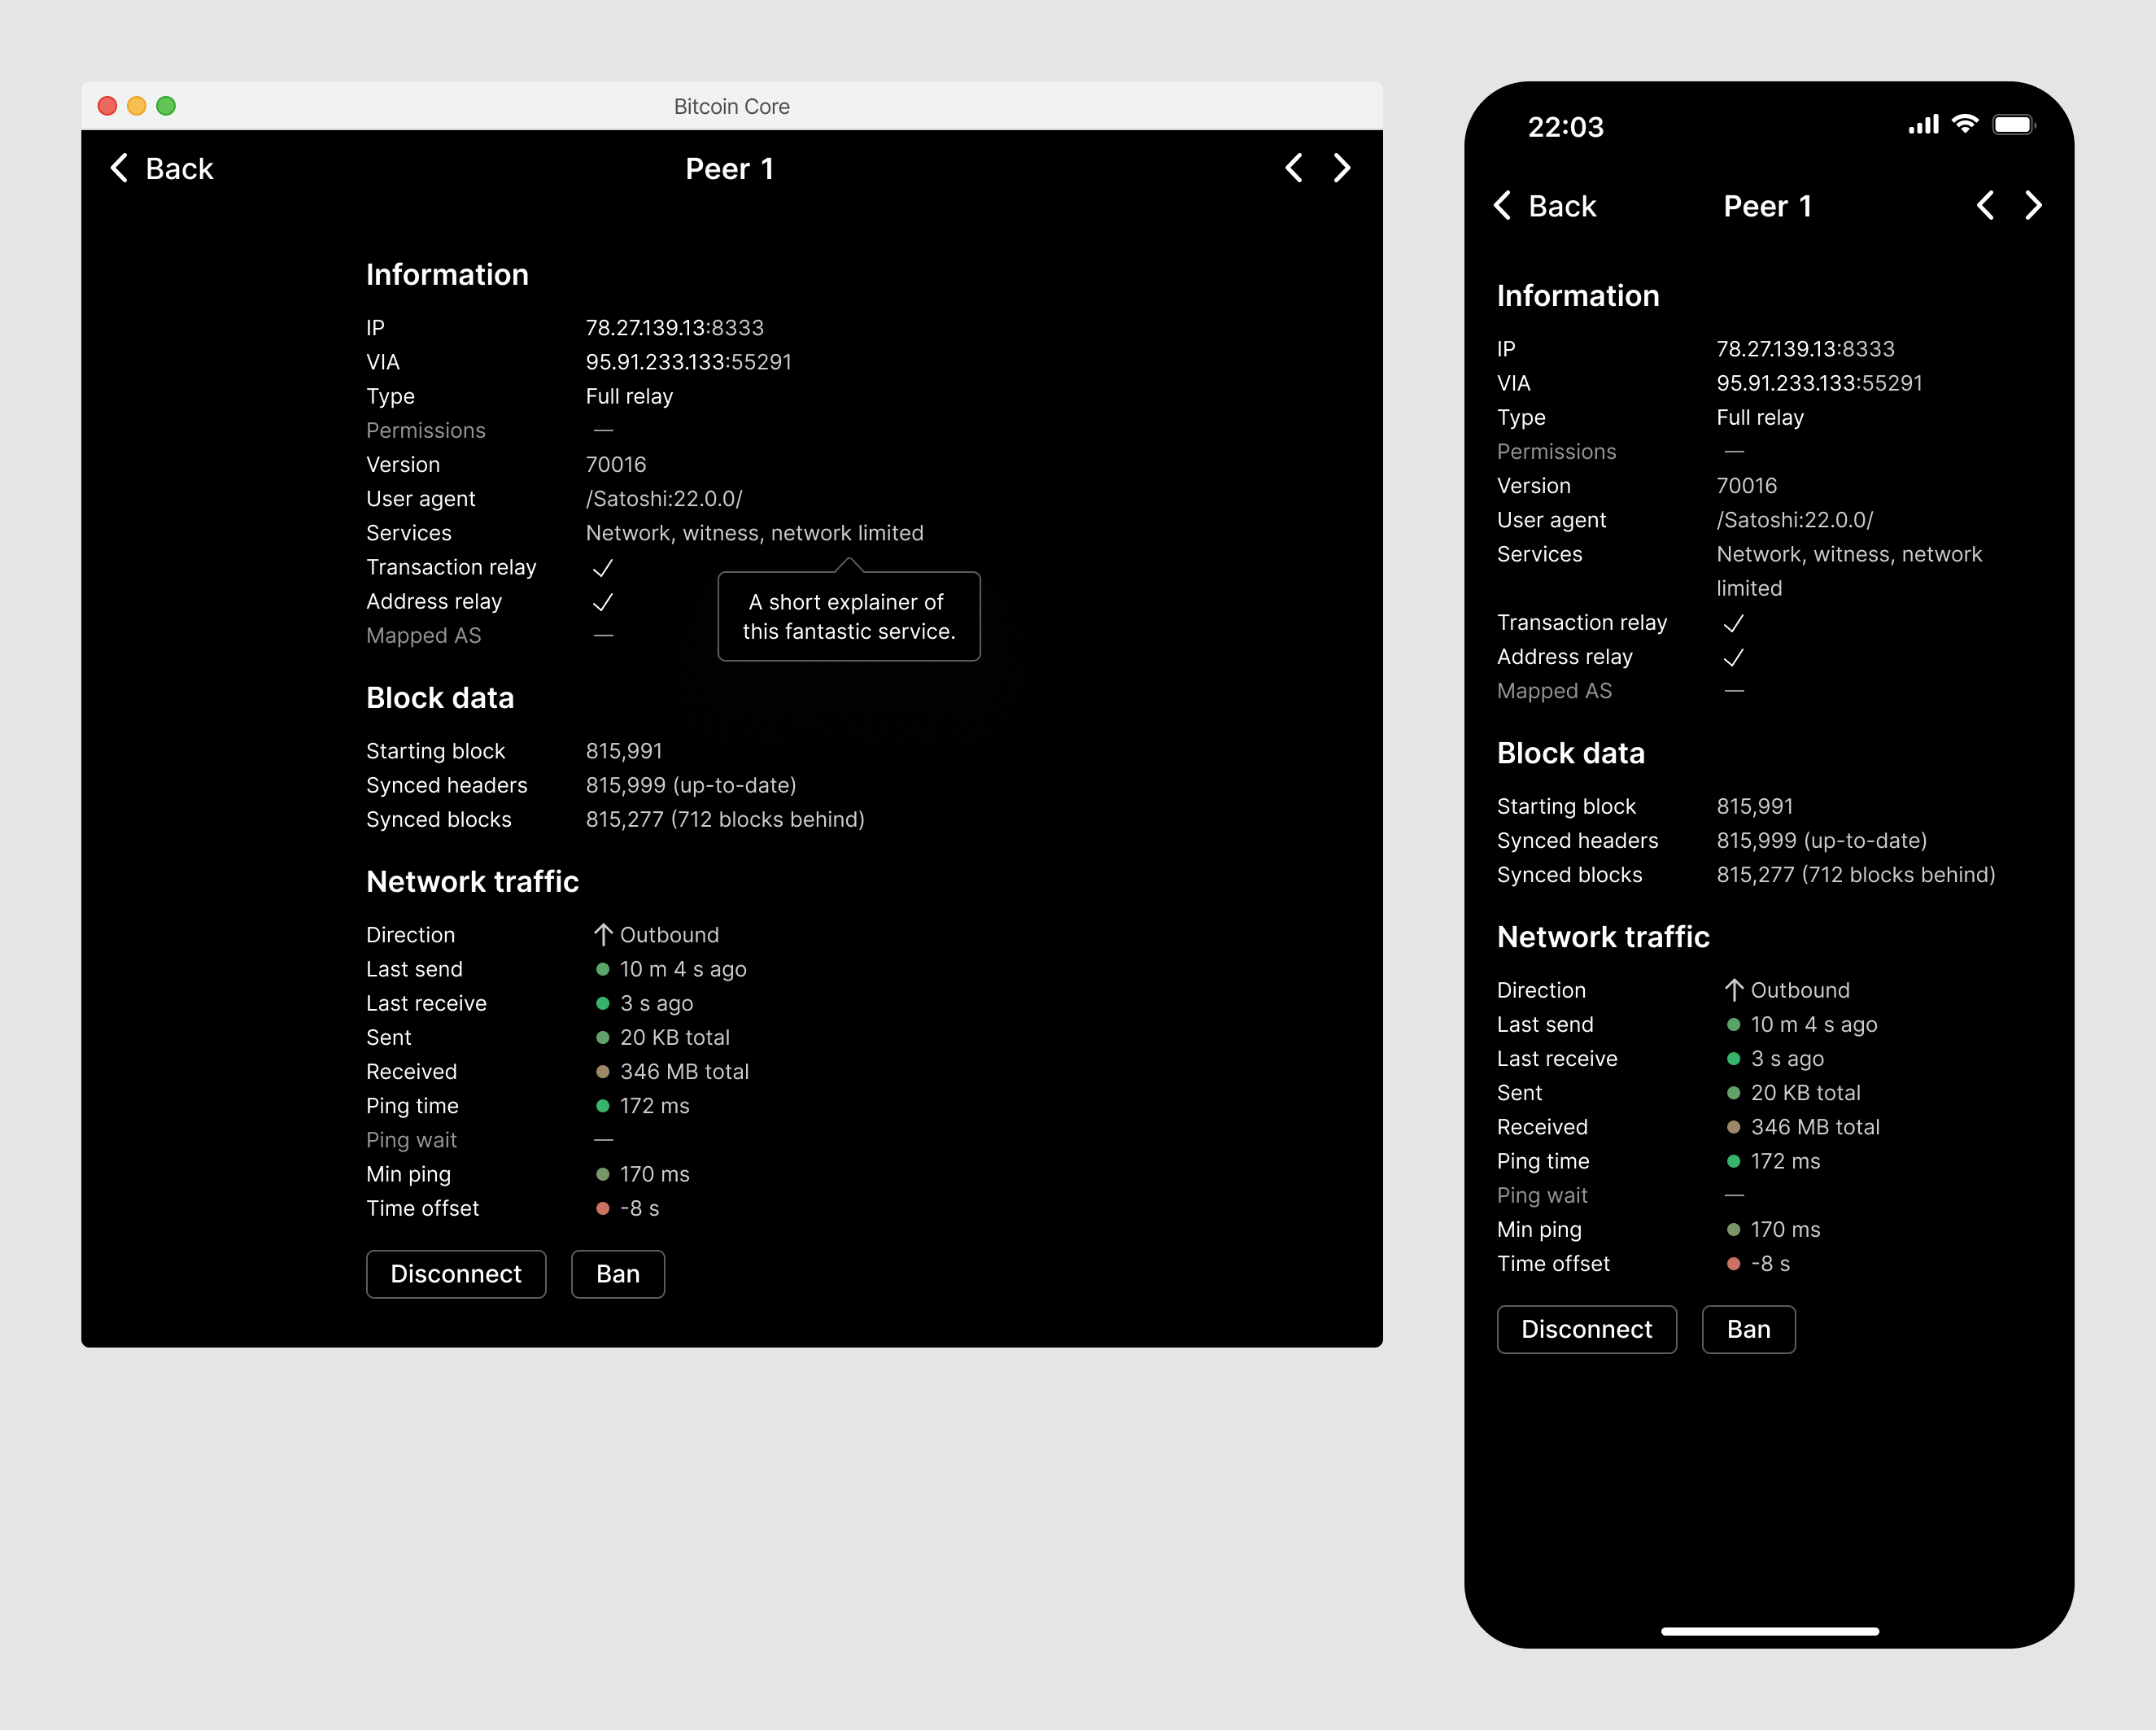
Tapping a peer reveals all the details in a new screen. The information is split up into categories. In addition to showing the value of each field, an evaluation is shown whenever possible to help users understand and act on the data.
Below is a first draft. The details should be refined over time and with practical input from users who closely work with this data. Users should be able to easily understand whether this connection is helpful to them, the peer, and the network. Some ideas:
- Use dots with a mix of red & green to indicate the quality/performance of a value (red is bad, green is good, see the colors page)
- Tool tips for Strings like the ones used in Services to explain what each one does
- For block data, indicate how it compares to the users node
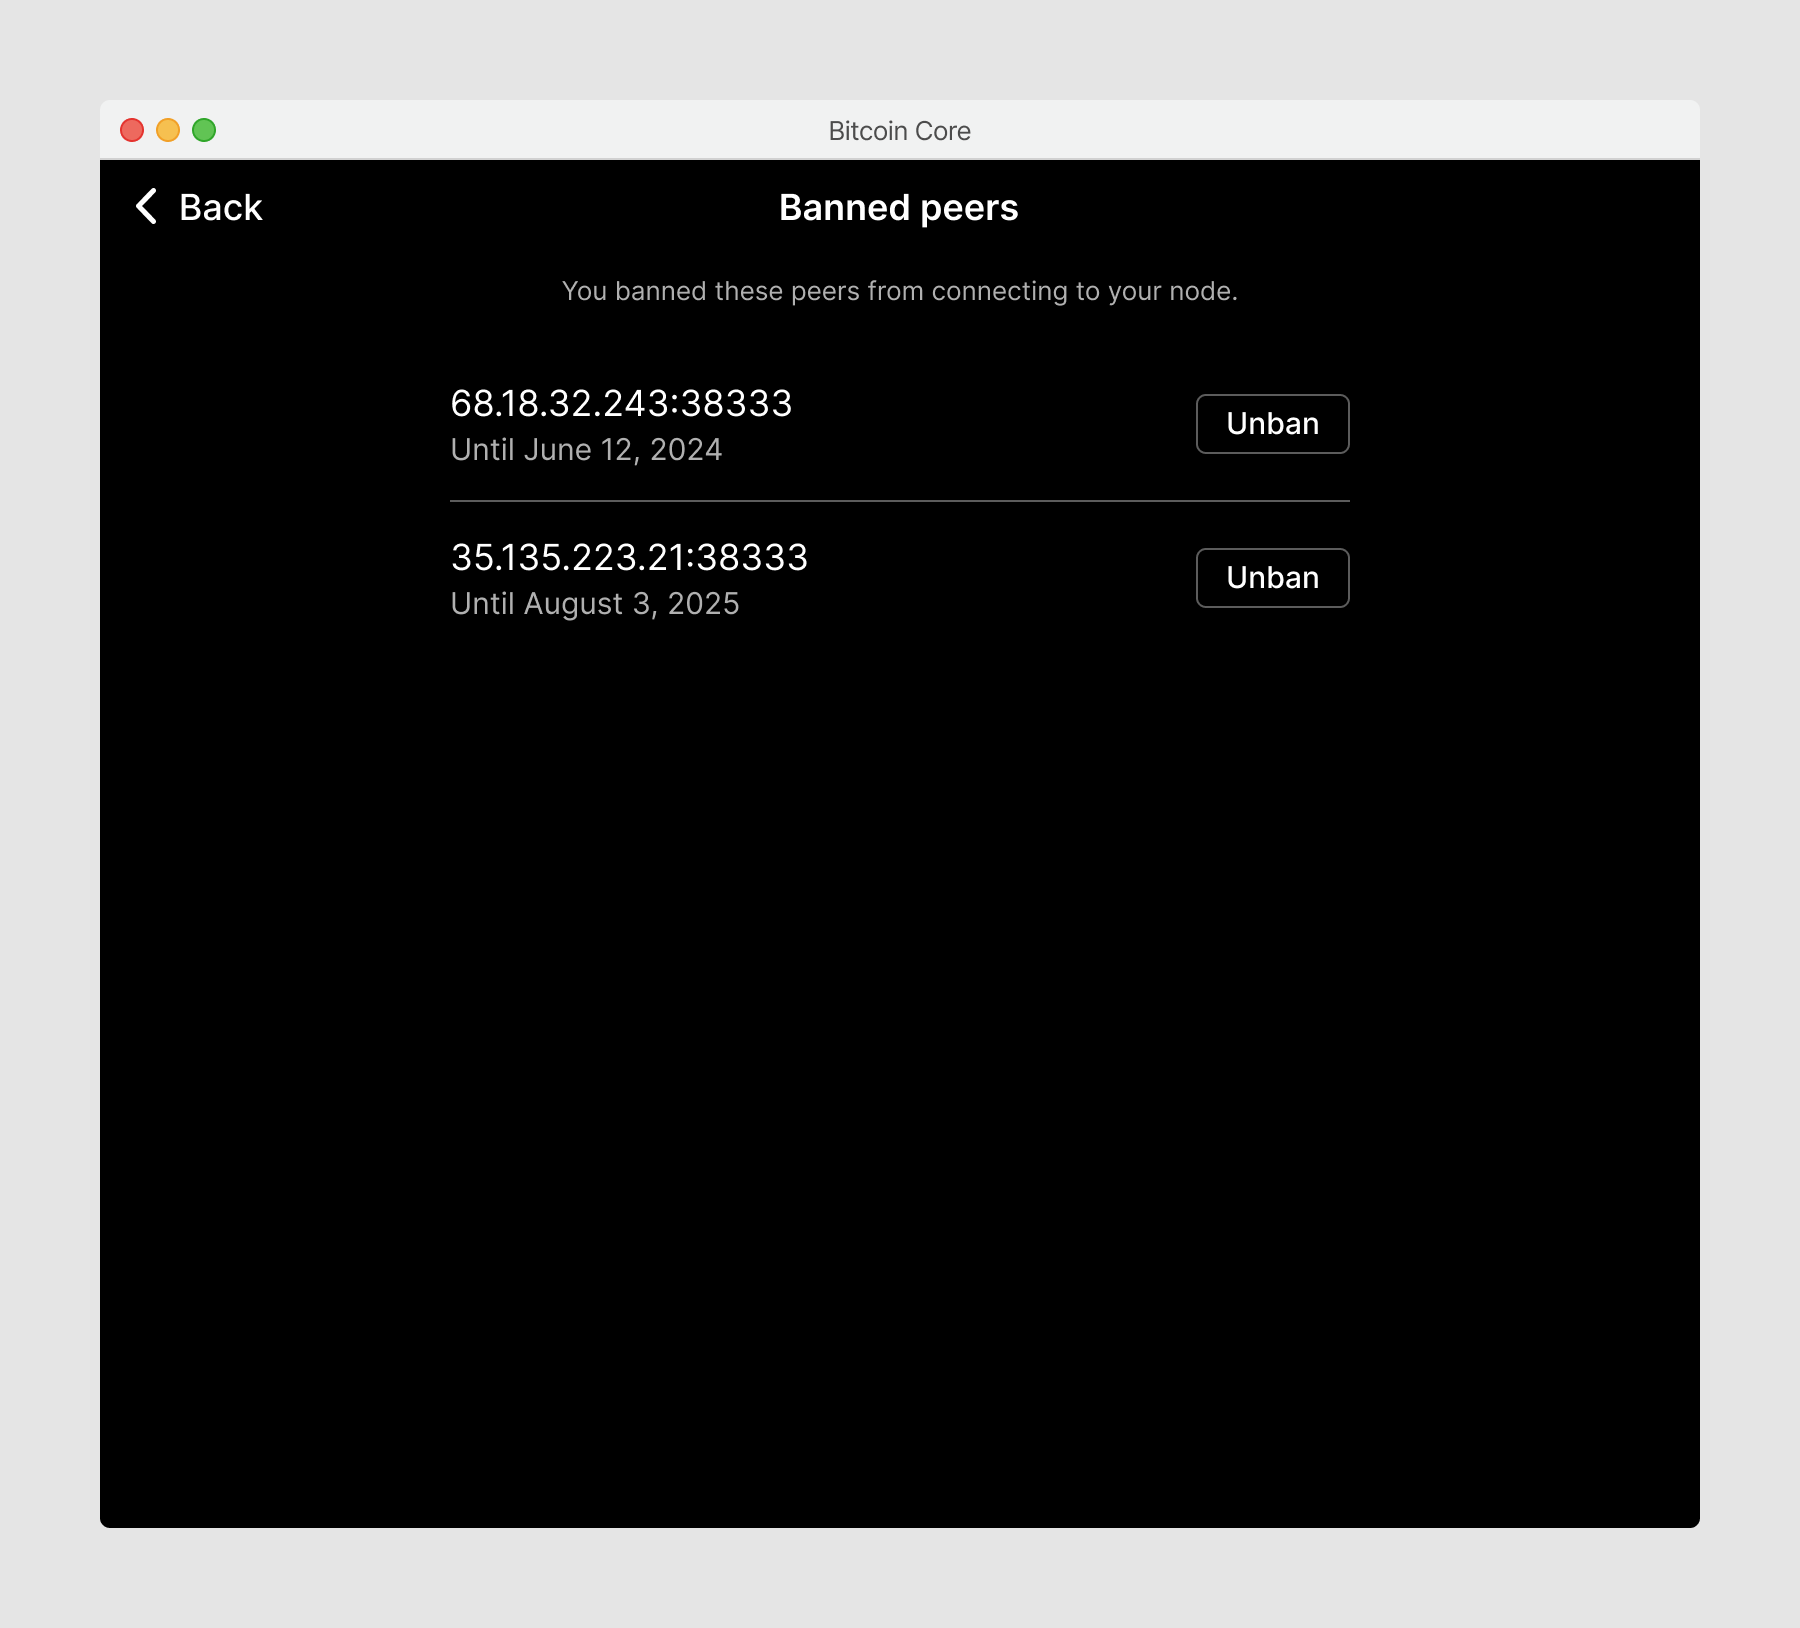
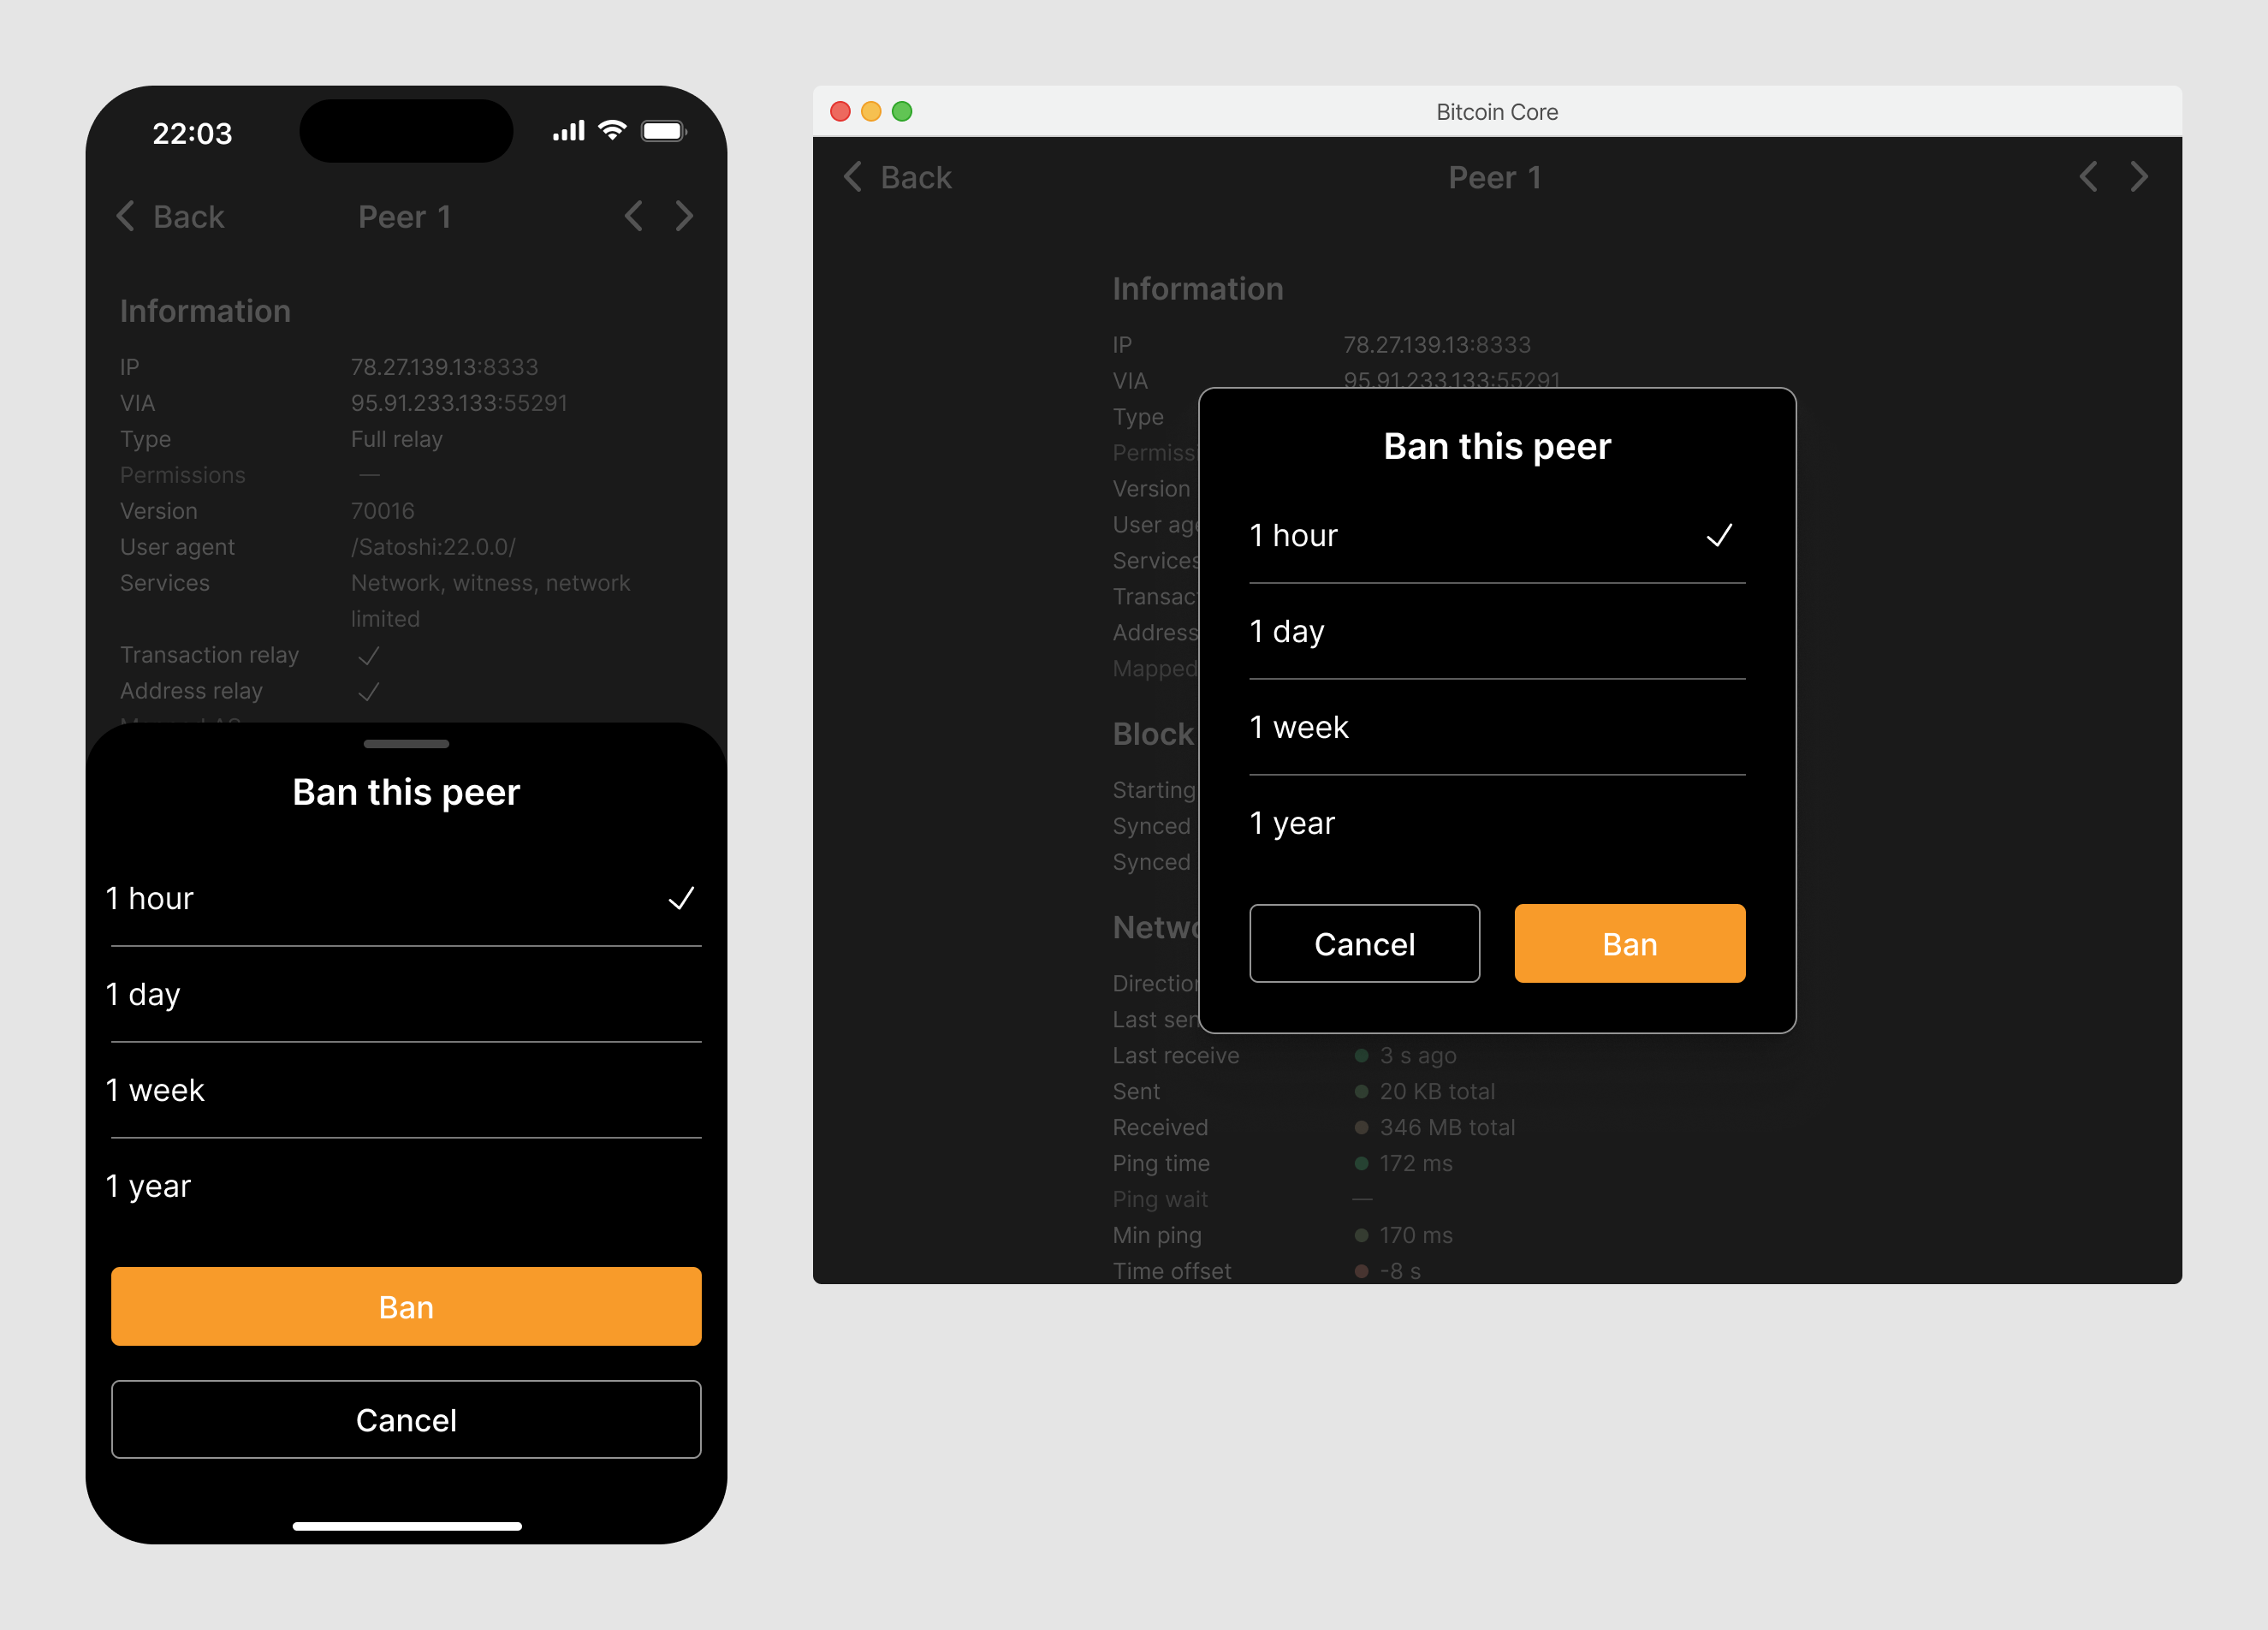
Peers can be banned for different time periods.
The list of banned peers can be accessed via a small link at the bottom of the connected peers list (see above).